In this chapter, you'll learn how to set different colors, sizes and other customized settings.
Nodes can be colored in several different ways: 1) general color scheme, 2) algorithmically or 3) user-specified.
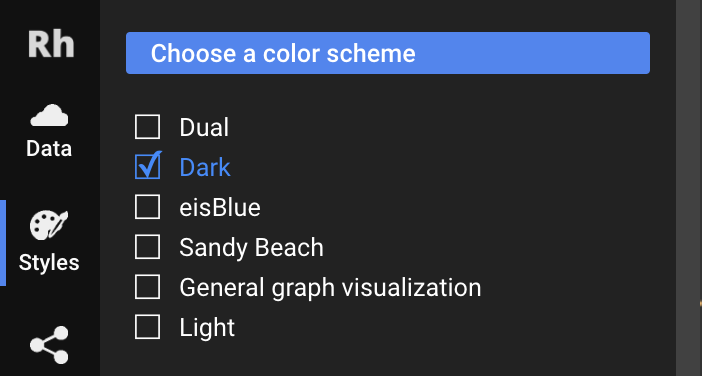
The first way — via a general color scheme — is the broadest. A color scheme is a general preset of rules and colors. Think of it as an easy way to get a color palette up and running. You can change the color scheme at any point in Graph Studio under the button.

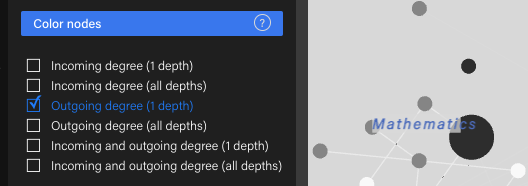
By default, choosing a color scheme will color nodes algorithmically— this means that they are automatically colored based on the connections they have. Also by default, nodes that have the highest number of incoming edges will be the brightest (against a dark background) or darkest (against a white background). You can change this in the Node coloring section of the editor:
For example, if you want nodes with the highest number of immediate incoming edges, choose the first option (Income degree (1 depth)). As another example, if you want the highest number of outgoing edges to all depths, choose the last option.
fill
Finally, the third and most fine-grained way of coloring nodes — specifying colors yourself. In Graph Studio, click on the tab of an entity:
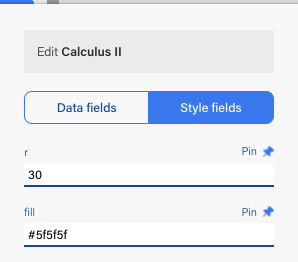
Changing the fill value will change the color of the node.
You can also do this in your spreadsheet. To specify colors in your spreadsheet, add a column called fill::. Put the RGB hex color code, e.g. #ff00aa, and that node will have the specified fill color:
stroke and strokeWidth
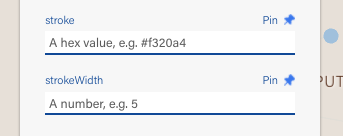
To specify a color for the outline (stroke) of the node, change the stroke value in the Style fields and put a number in the strokeWidth field. The strokeWidth field is mandatory because it describes how thick the stroke is — a strokeWidth of 0 means there is a line of zero thickness, which is invisible!
To do this in a spreadsheet, create a column called stroke:: and specify a hex value in the cell.
r
The radius of a node is governed by the field r. To change this in Graph Studio, change the r input value:
To do this in a spreadsheet, create a column called r:: and specify a number value in the cell, e.g. 30.
Pro tip! We recommend a minimum radius of 25. Nodes that are too small are hard to hover on and don't look as good as bigger nodes.
Can I change the radius of the node algorithmically? Not yet! This is on the feature list and will be available soon.
You may have noticed that there is a little Pin symbol for each styling attribute that automatically becomes pinned when you change its value. This concept is called pinning and it means to “fix” this custom value that you have set.
In the above example, we have pinned the value of fill at #ff00aa. This means that even if you change the general color scheme, the color of this node will stay fixed. To unpin a style, simply click on the Unpin symbol.
Sometimes, you may find it easier to pin (or unpin) everything at once. To do this, click on the dropdown and select the Bulk pin option. This will pin or unpin all custom styles, including radius, fill, etc., of every entity.


