You can control how “spread out” your map looks by adjusting the spacing slider:
This affects the spacing between groups and not nodes. The higher the value, the further apart your groups.
While the group spacing slider controls the spacing between groups, the link length slider controls the distance between nodes:
The larger the value, the further spaced nodes will be. For aesthetic purposes, we recommend that if you increase the link length, you also increase the distance between groups.
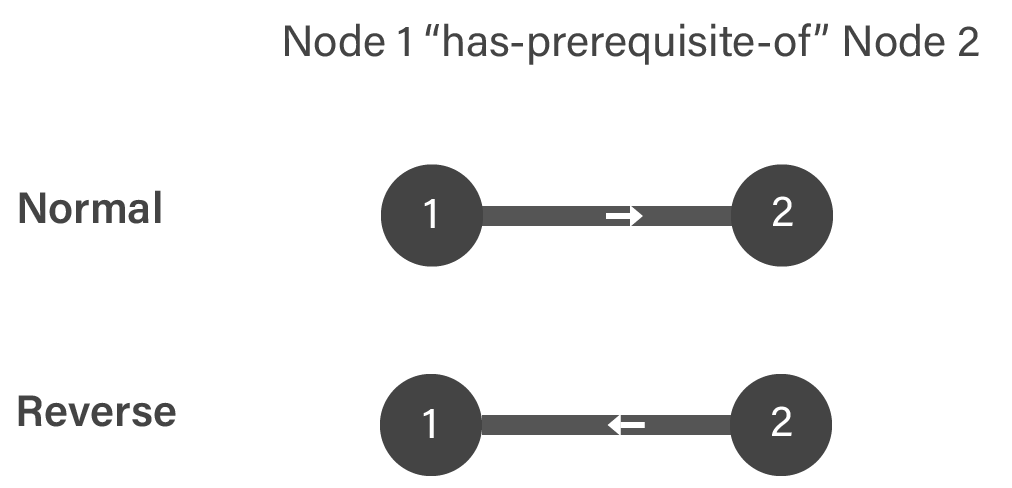
Customize in which direction arrows point. The default (aka "Normal") direction is from source → target. For example, if there is a relationship in which Math 2 is the source, and Math 1 is the target, then an arrow in the Normal direction will point from Node 2 to Node 1:
Depending on the way you name your relationships, you may want the arrows to point in the reverse direction. For example, it is usually easier to list prerequisites of a course, than to list the follow-ons of a course. In your Excel then, you have prerequisite relationships pointing from source to target. However, viewers are used to arrows signifying a path of advancement. This is a common use case for changing the directionality of the arrows.
You can change this setting such that arrows point in the reverse direction:
Be careful: This is simply a visual change — your data remains the same. Changing the directionality of the arrows often leads to confusion when selecting mouseover pathways (see below).