In this section, you'll learn to customize search and mouseover behaviors for viewers of your network visualization.
When you mouseover (hover over) a node, other connected nodes can light up based on the graph algorithm you choose.
There are six different behaviors to choose from. These behaviors are based on your data, and not on the visual direction of your arrows. This confusion often arises when you select a Reverse direction for your edges, and wonder why the incorrect nodes are lighting up on mouseover.
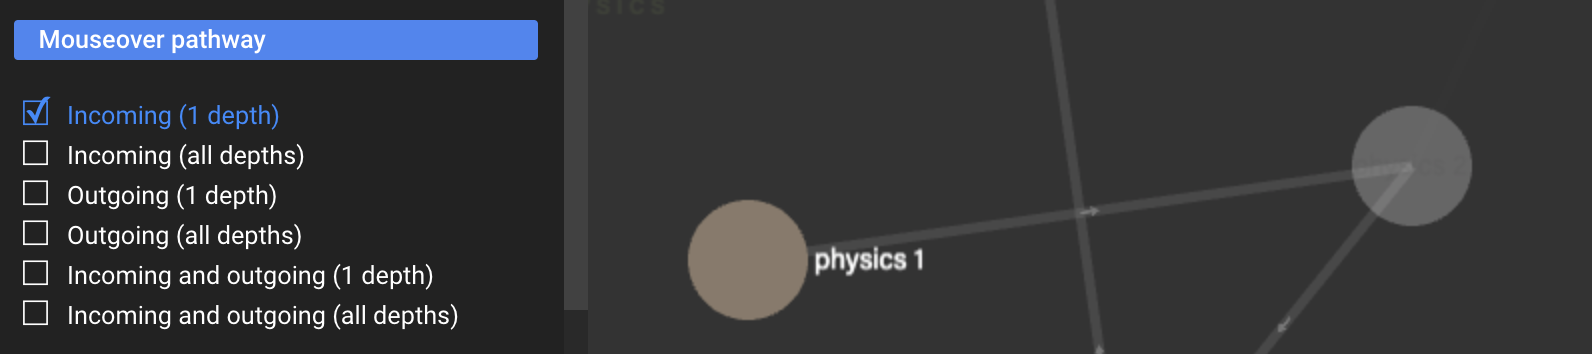
Incoming (1 depth) Nodes that are directly connected (i.e. immediate neighbors) by an edge that points towards the node being mouseovered will light up.
In the example below, there are no incoming edges, therefore, no other nodes are lit up.
Incoming (all depths) Nodes that are directly connected by incoming edges and their neighbors will light up. This means that if you have A ← B ← C ← D, and you mouseover on A, then all A, B, C and D will light up.
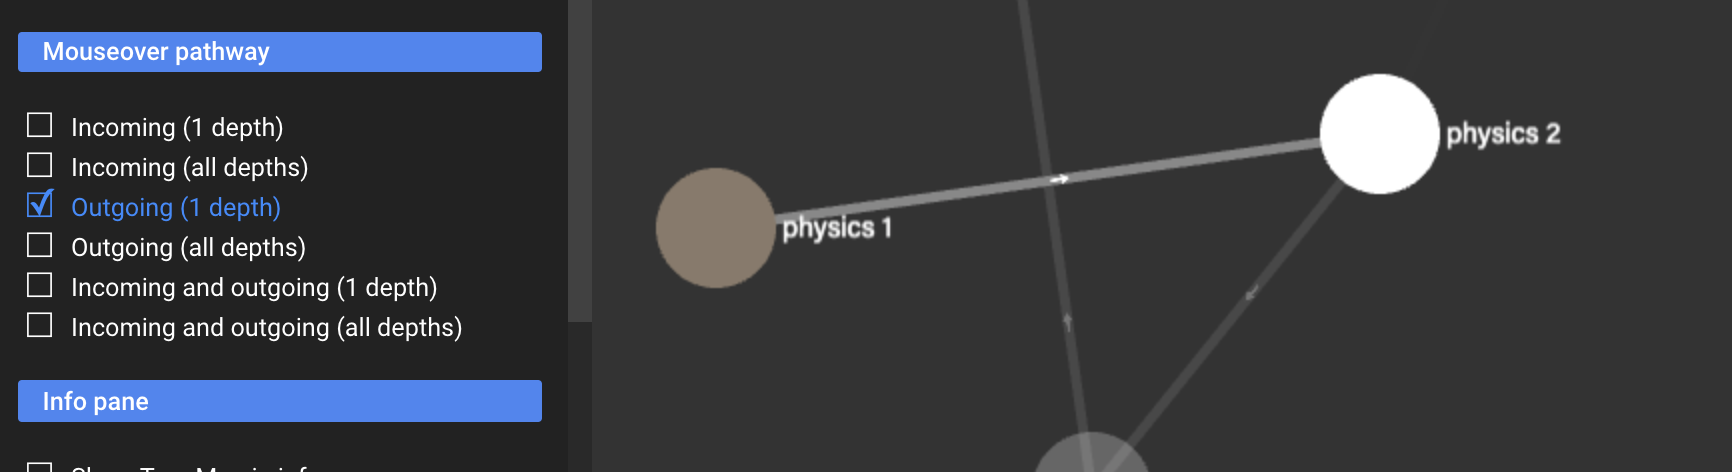
Outgoing (1 depth) Nodes that are directly connected (i.e. immediate neighbors) by an edge that points away the node being mouseovered will light up.
In the example below, only Physics 2 is lit up because it is the only node that is directly connected by an outgoing edge from Physics 1.
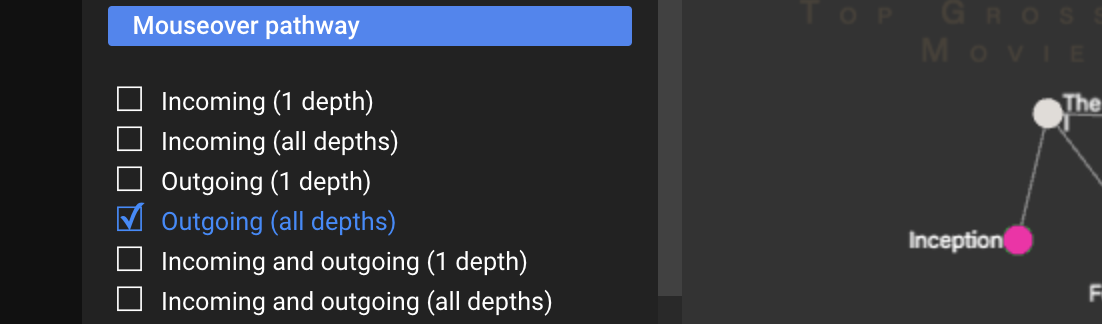
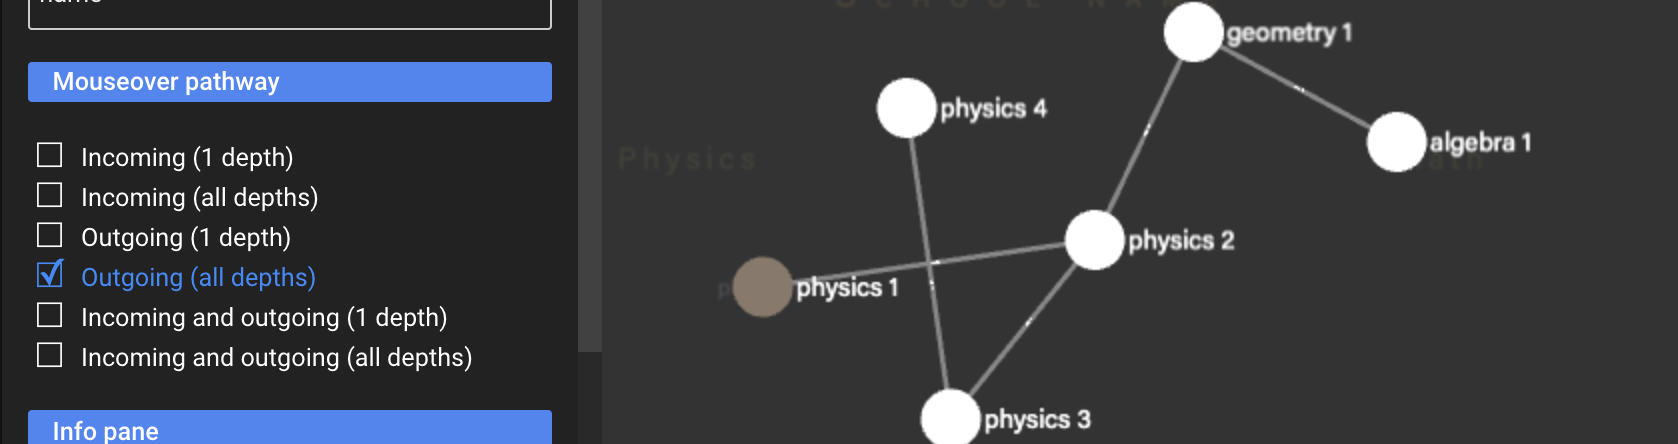
Outgoing (all depths) Nodes that are directly connected by outgoing edges and their neighbors will light up. This means that if you have A → B → C → D, and you mouseover on A, then all A, B, C and D will light up.
Incoming and Outgoing (1 depth) Nodes that are directly connected (i.e. immediate neighbors) by an edge that points towards or away the node being mouseovered will light up. This is the combination of #1 and #3.
Incoming and Outgoing (all depths) Nodes that are directly connected by incoming or outgoing edges and their neighbors will light up. This is the combination of #2 and #4.
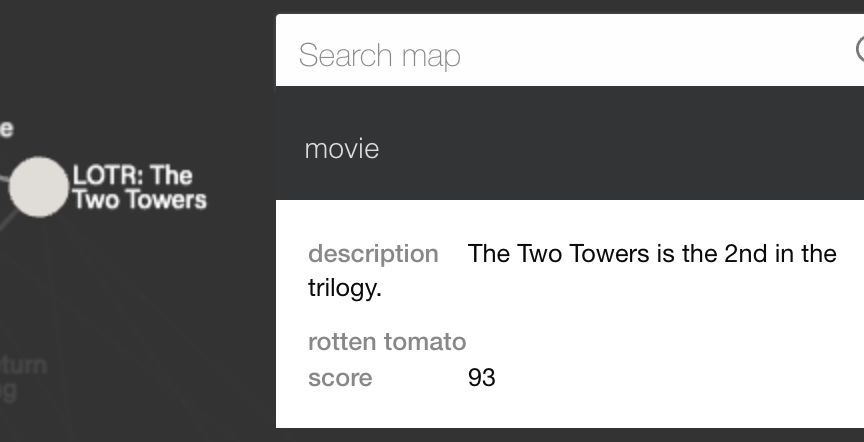
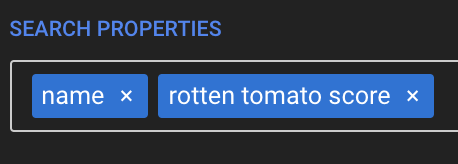
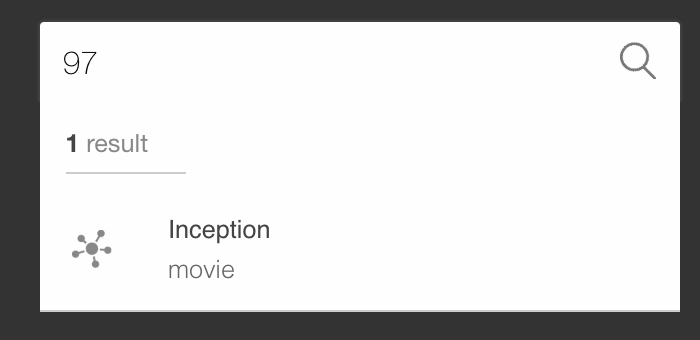
When users type to search into the search box, Rhumbl searches your entities that match the user's search input. By default, Rhumbl searches against the name property of an entity, but you can add or remove properties against which to search by using the Search Properties dropdown. In the below example, selecting that the field rotten tomato score will tell Rhumbl to not only search against the name of an entity, but also match against the rotten tomato score value of an entity.
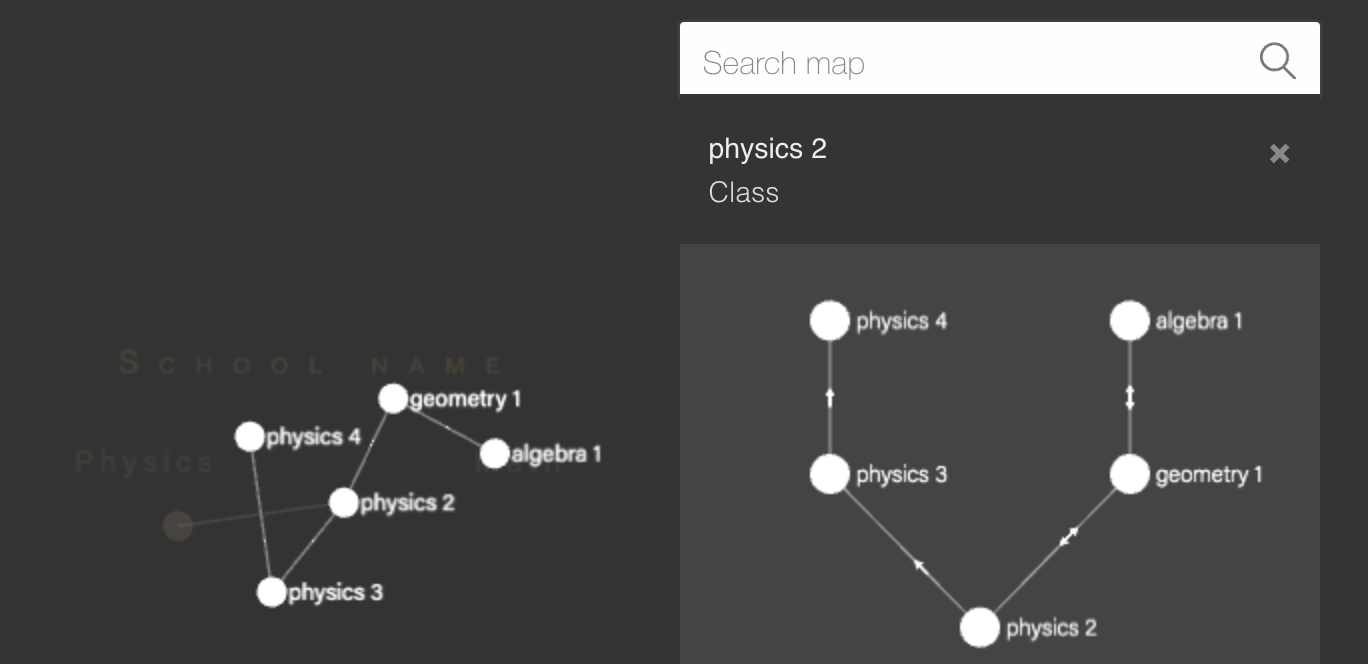
The Info Pane appears when a node is clicked on, or if a search result is selected. You can customize the:
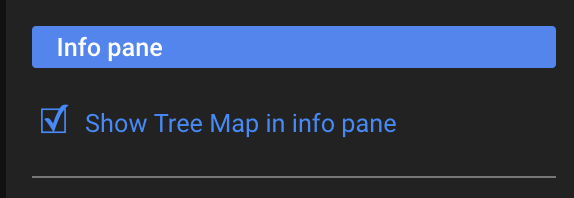
Tree Map The Tree Map shows the chain of dependency of the clicked-on node:
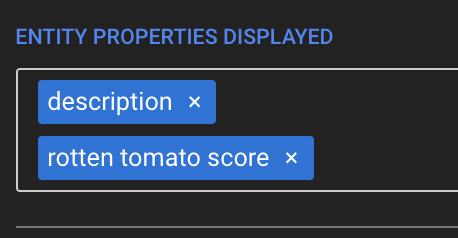
Entity Properties displayed You can choose what entity properties (columns in your spreadsheet) are displayed in the Info Pane: