New feature release! Draw nodes, relationships, export network data to Excel, oh my!
Jul 14, 2020

Today we released a big feature in Rhumbl Graph Studio — the ability to edit data right in your browser! This is an awesome release, one we've been working on for a long time. This latest release is chock-full of features, and is a total game-changer for anyone who is a visual person.
Previously, Rhumbl expected you to fill in a spreadsheet, either in Adjacency List Adjacency Matrix format, and then upload it to Graph Studio. Now, in addition to still being able to upload spreadsheets, you can actually edit data within Graph Studio. For example, you can add nodes, delete relationships and refresh your network layout. When you are done editing, you can export a spreadsheet form of your data, and re-import it.
These features are all part of the visual editing focus. Visual editing makes editing network data so much easier, since you can see changes side-by-side as you change data.
Take a look at some screenshots of the new features:
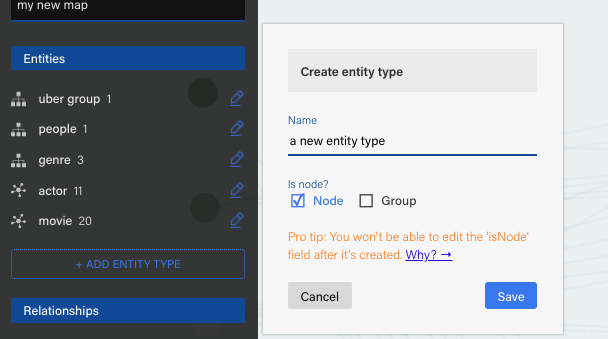
Add, edit and delete entity types
Create, edit and delete entity types, e.g. "subject", "person", etc.
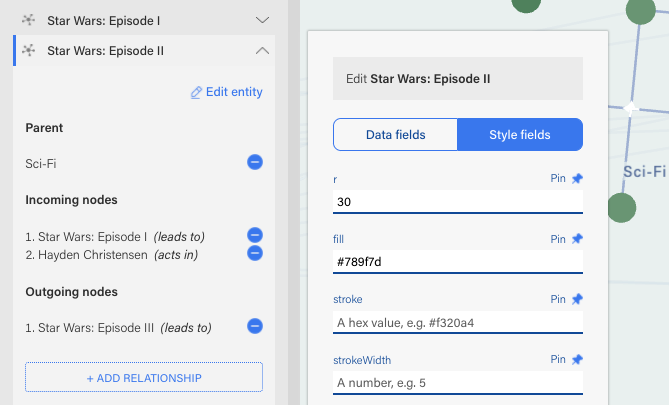
Add, edit and delete entities
Add as many data fields as you want, and...[drum roll]... change the fill color, stroke color, stroke width and radius of nodes!
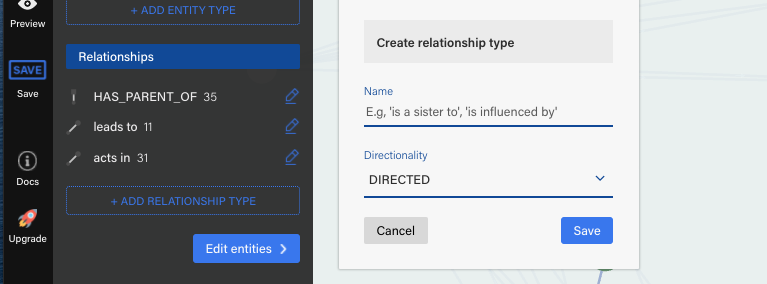
Add, edit and delete relationship types
Create, edit and delete entity types, e.g. "has influence on", "sells to", etc.
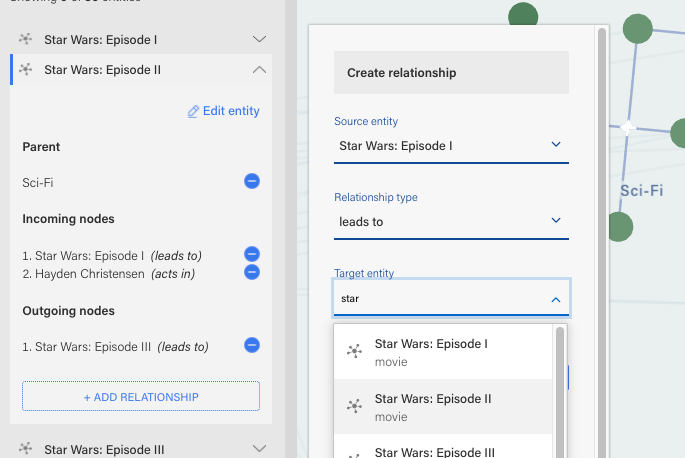
Add, edit and delete relationships
Easily specify relationships between any two entities
Pinning
We also introduced the concept of "pinning" a style. By default, styles that pertain to a node, for example, radius, fill, etc., are unpinned. This means that when you change the general coloring scheme, the node's styles change per the scheme you choose. However, you can pin the style such that it remains fixed — now when you change the general color scheme, the node's styles will remain fixed.
Exporting
You can now export your map back to Excel spreadsheets! Currently, we only offer exporting back to the Adjacency List format, but we'll soon be releasing the ability to export to Adjacency Matrix format.
Stamp out maps
Last, but not least in this latest release, you can stamp out maps from examples! Previously, you could only make new maps by importing spreadsheets. Now, you can click to stamp out new maps from examples. This makes creating new maps so much easier.
Try it now! Go to your Graph Editor dashboard to make a new map.